I expected a bigger speculative block to be faster. DFlash could propose more tokens per iteration, the target model could accept more of them, and the server would need fewer sequential decoding steps. That is the usual intuition behind speculative decoding.
On an NVIDIA GB200, the first half of that intuition held. Increasing DFlash’s block size from 8 to 16 raised the average acceptance length at every concurrency I tested. But at 16 concurrent requests, the larger block delivered lower aggregate output throughput: 2,878 tokens/s versus 2,985 tokens/s for block size 8.
The difference is only 3.6%, and these are single-run measurements, so I would not treat it as a definitive ranking without repeats. It was enough, though, to motivate a closer look at what the GPU was doing.
I benchmarked Qwen3.5-9B in SGLang across a non-speculative baseline and two DFlash configurations, then used Nsight Systems to compare kernel execution and CUDA API behavior. Here is what I measured, what the traces show, and where the explanation remains incomplete.
Why DFlash?
Ordinary autoregressive inference generates one token after another. A large target model must complete a decoding step before it can produce the next token. That sequential dependency is costly, especially when a powerful GPU is serving only a handful of requests.
Speculative decoding tries to advance the sequence more than one token per target-model step. A drafter proposes candidate tokens; the target evaluates them, and an acceptance procedure decides how much of the proposal can be kept. The benefit depends on how many useful tokens are produced relative to the cost of drafting, verification, and bookkeeping.
DFlash uses a block-diffusion drafter, generating and refining a block of candidate token positions rather than drafting only through a conventional sequential autoregressive process. It incorporates information from the target model into the draft process. I used the DFlash Qwen3.5-9B checkpoint with SGLang’s DFLASH speculative algorithm.
Block size is a natural knob to explore. A larger block offers more opportunities for acceptance but requires work on more candidate positions. The highest acceptance length is therefore not necessarily the highest-throughput configuration.
Setup and benchmark methodology
All experiments ran on one NVIDIA GB200, with the same target model, serving framework, and benchmark parameters.
| Setting | Value |
|---|---|
| GPU | NVIDIA GB200 (Blackwell) |
| Target | Qwen/Qwen3.5-9B |
| Drafter | z-lab/Qwen3.5-9B-DFlash |
| SGLang | 0.5.23 |
| CUDA / PyTorch | CUDA 13.0; PyTorch 2.14.1+cu130 |
| Configurations | Autoregressive baseline; DFlash blocks 8 and 16 |
| Max concurrency | 1, 4, 16 |
| Benchmark requests | 64 per configuration; 5 warmup requests |
| Prompt / output settings | Random input length 512; random output length 256 |
| Request rate / sampling | Unlimited request rate; temperature 0; seed 42 |
| Profiling | Nsight Systems 2025.4.1 |
These are synthetic closed-loop concurrency tests, not production traffic traces or fixed-rate arrival experiments. --random-output-len 256 is a workload-generation setting, not a guarantee that all requests emit 256 tokens. In the initial comparable results, each configuration generated 8,341 output tokens over 64 requests—about 130 tokens per request. I used the benchmark-reported actual output throughput.
The baseline used the same target-side serving configuration as DFlash, without the speculative algorithm and draft model. DFlash used trtllm_mha for full attention, flashinfer for linear attention prefill/decode, and fa4 for draft attention, with a maximum of 32 running requests and a maximum decode CUDA graph batch size of 32. Tensor parallelism was 1.
An abbreviated DFlash launch command (the block-16 run changed only the value of --speculative-dflash-block-size):
export SGLANG_ENABLE_OVERLAP_PLAN_STREAM=1

sglang serve \
  --model-path Qwen/Qwen3.5-9B \
  --trust-remote-code \
  --speculative-algorithm DFLASH \
  --speculative-draft-model-path z-lab/Qwen3.5-9B-DFlash \
  --speculative-dflash-block-size 8 \
  --speculative-draft-attention-backend fa4 \
  --attention-backend trtllm_mha \
  --linear-attn-prefill-backend flashinfer \
  --linear-attn-decode-backend flashinfer \
  --mamba-radix-cache-strategy extra_buffer \
  --mamba-ssm-dtype bfloat16 \
  --tp-size 1 \
  --max-running-requests 32 \
  --cuda-graph-max-bs-decode 32 \
  --cuda-graph-backend-prefill breakable \
  --flashinfer-allreduce-fusion-backend auto \
  --mem-fraction-static 0.8 \
  --host 127.0.0.1 --port 30000
A representative benchmark invocation was:
python -m sglang.benchmark.serving \
  --backend sglang-oai \
  --base-url http://127.0.0.1:30000 \
  --model Qwen/Qwen3.5-9B \
  --dataset-name random \
  --random-input-len 512 \
  --random-output-len 256 \
  --num-prompts 64 \
  --request-rate inf \
  --max-concurrency 16 \
  --warmup-requests 5 \
  --seed 42 \
  --temperature 0
Measurement caveat: The nine benchmark entries below come from one unprofiled run per configuration, not repeated trials. Differences of a few percent—especially the block-8 versus block-16 comparison at concurrency 16—may include run-to-run noise.
Result 1: speculation helps most at low concurrency
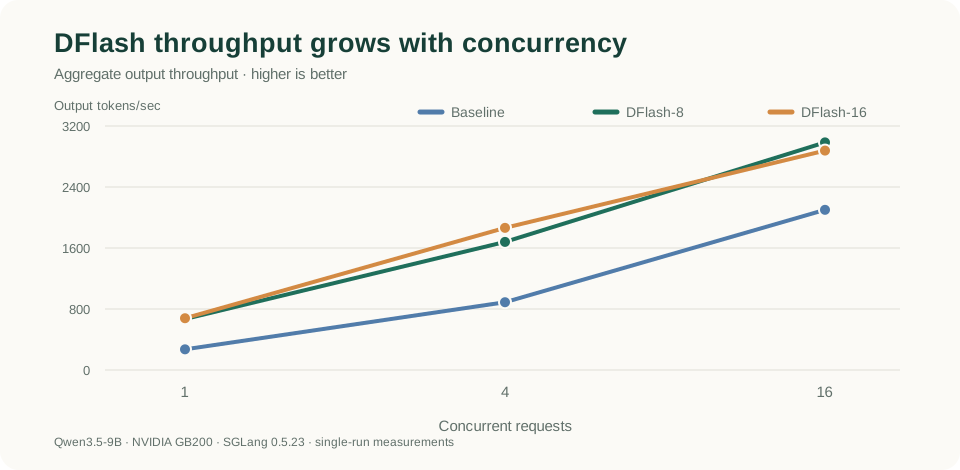
| Concurrency | Baseline tok/s | DFlash-8 tok/s | DFlash-16 tok/s |
|---|---|---|---|
| 1 | 271.12 | 668.64 | 678.92 |
| 4 | 888.93 | 1,679.91 | 1,864.21 |
| 16 | 2,100.59 | 2,985.04 | 2,877.56 |
At concurrency 1, block 8 achieved 2.47× baseline output throughput; block 16 achieved 2.50×. The absolute throughput of both DFlash configurations increased with concurrency, but their relative speedup fell.
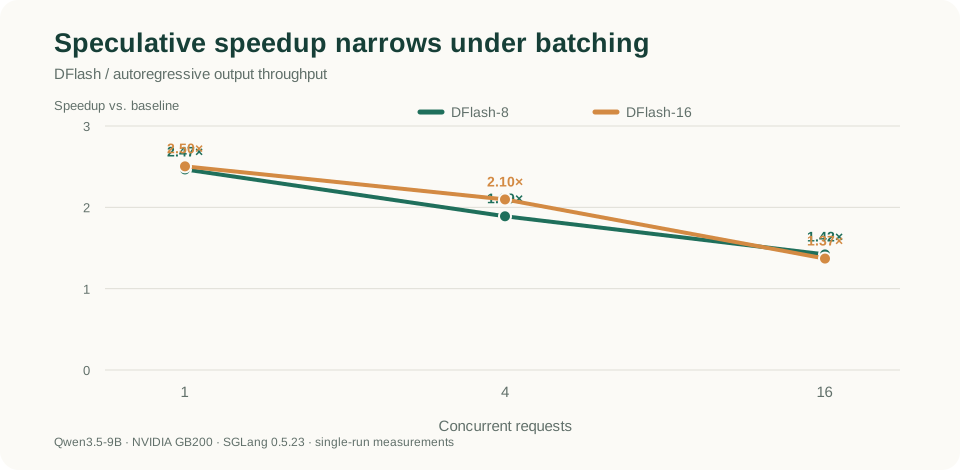
| Concurrency | DFlash-8 / baseline | DFlash-16 / baseline |
|---|---|---|
| 1 | 2.466× | 2.504× |
| 4 | 1.890× | 2.097× |
| 16 | 1.421× | 1.370× |
One possible interpretation is that the conventional baseline benefits disproportionately from batching as concurrency grows. At low concurrency, sequential decoding may underutilize the GPU; more simultaneous requests can amortize overhead and improve device utilization. DFlash also batches work, but it carries the added cost of drafting and verification.
The measurements establish the decreasing relative speedup. They don’t, by themselves, prove batching is the mechanism.
Result 2: the acceptance-throughput tradeoff
The acceptance-length measurements were remarkably consistent across concurrency levels:
| Concurrency | Block 8 average acceptance | Block 16 average acceptance |
|---|---|---|
| 1 | 4.19 | 4.87 |
| 4 | 4.22 | 5.01 |
| 16 | 4.24 | 5.11 |
At C16, the longer block improved reported average acceptance length by about 20.5%. Yet it reduced measured throughput by 3.6%.
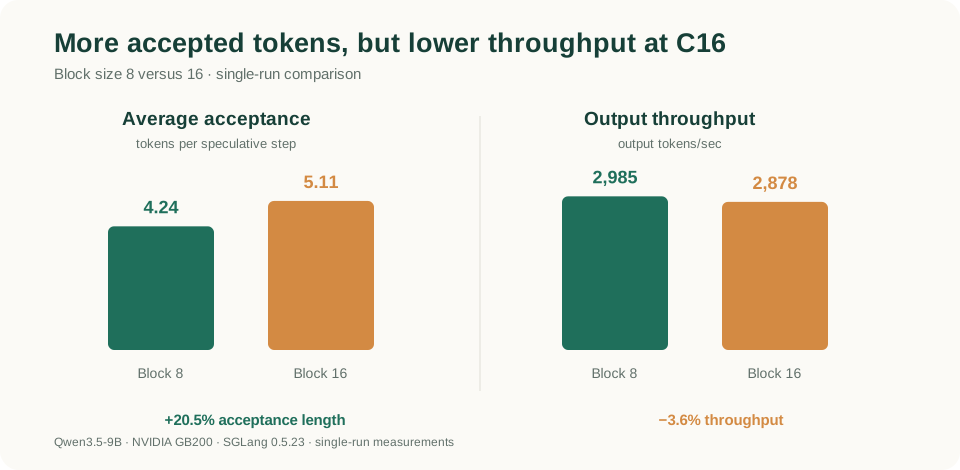
The throughput change from block 8 to 16 was +1.5% at C1, +11.0% at C4, and −3.6% at C16. So even in one set of measurements, the preferred block size depended on the level of concurrency.
A simple mental model for an isolated speculative cycle is:
useful tokens per second
    ≈ accepted tokens / (draft time + verify time + other overhead)
A longer block can raise the numerator, while also raising the denominator. In a concurrent server, the real relationship is more complicated: multiple requests are batched together, GPU operations may overlap, and different batches can select different kernel shapes. But the essential lesson remains: acceptance length is not the optimization objective; useful throughput is.
The latency data also illustrate that different metrics can favor different choices. At C16, block 16 had lower mean TTFT (166.54 ms versus 198.20 ms) but higher mean TPOT (3.84 ms versus 3.59 ms) than block 8. A configuration can improve response startup while making subsequent token generation slower.
Result 3: Nsight Systems points to recurrent-state execution costs
To understand the GPU-side tradeoff, I captured warmed-up DFlash execution with Nsight Systems at C1 and C16, then compared blocks 8 and 16 at C16. The profiler traced CUDA APIs, GPU kernels, NVTX, and CUDA graph nodes, using SGLang’s CUDA-profiler start/stop mechanism to avoid primarily measuring model startup.
nsys stats \
  --report cuda_gpu_kern_sum \
  --report cuda_api_sum \
  --report nvtx_sum \
  profiles/dflash_bs16_c16.nsys-rep
The most informative block-size differences at C16 were two recurrent-state-related kernel families:
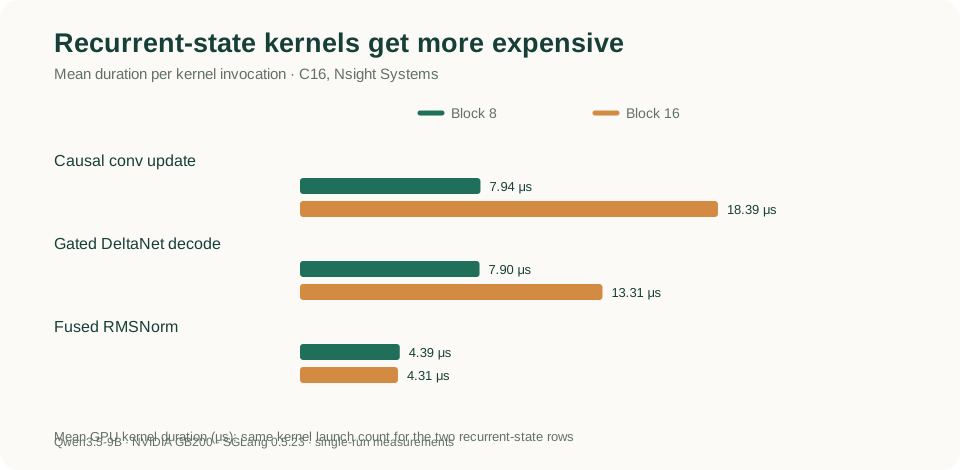
| Kernel | Block 8 mean | Block 16 mean | Invocations in each capture |
|---|---|---|---|
_causal_conv1d_update_kernel |
7.94 μs | 18.39 μs | 408 |
Gated DeltaNet decode (gdn_decode_bf16state_mtp) |
7.90 μs | 13.31 μs | 360 |
| Fused add + RMSNorm | 4.39 μs | 4.31 μs | 1,484 |
For the two recurrent-state kernels, the call counts were unchanged but the average time per invocation increased: approximately 2.32× for the causal convolution update and 1.68× for Gated DeltaNet decode.
Summed across the captures, causal convolution update kernels rose from about 3.24 ms to 7.50 ms, and Gated DeltaNet decode kernels rose from about 2.84 ms to 4.79 ms. These are sums of kernel execution durations, not per-request critical-path times.
This matters for a hybrid model like Qwen3.5, where attention kernels coexist with recurrent-state computation. A change in speculative block size can alter how much state-processing work the runtime must perform, along with kernel shapes and execution strategies.
But I cannot yet attribute these kernels specifically to drafting versus target verification. Kernel names and aggregated counts aren’t enough to establish that mapping. The capture shows more expensive recurrent-state operations; it doesn’t prove they caused the 3.6% throughput difference.
GEMMs and split-K
Matrix multiplication dominated large portions of the GPU trace. In the block-8/C16 capture, several nvjet_sm100 GEMMs and cublasLt::splitKreduce_kernel accounted for a significant share of accumulated kernel time.
Split-K parallelizes a matrix multiplication over partitions of its reduction dimension, then combines the partial results. That can improve utilization for certain matrix shapes, at the cost of extra reduction work.
Block 16 selected a different mix of GEMM kernel shapes, including larger dimensions in some top kernels. The kernel selection changed as the speculative configuration changed, but a high-cost GEMM or split-K reduction is not automatically an inefficient GEMM. It may be doing necessary model computation efficiently.
CUDA graphs: present, but not an explanation by themselves
Both C16 captures showed 133 cudaGraphLaunch API calls. Their accumulated CPU-side API durations were very close: around 13.69 ms for block 8 and 13.57 ms for block 16.
That does not support the simple theory that block 16 is slower because it spends more accumulated CPU API time launching CUDA graphs.
These CUDA API durations are not GPU time, and they cannot simply be subtracted from end-to-end latency. Identifying critical-path stalls would require inspecting timing relationships between host calls and GPU execution.
Why I didn’t immediately optimize a kernel
The profiler’s top kernel is not necessarily the best optimization target. A useful investigation needs to determine whether time is on the critical path, whether the work is avoidable, and whether another configuration can perform it more efficiently without harming correctness.
For the same reason, I didn’t treat the roughly 5.7% increase in summed GPU kernel execution time for block 16 as a measurement of a 5.7% per-token slowdown. The capture windows contain slightly different mixes of work and are not normalized by accepted output tokens; GPU execution can overlap, too.
What the evidence supports
There are three solid observations from this particular setup:
- DFlash improved aggregate output throughput over the non-speculative baseline at all three tested concurrency levels, with the largest relative gains at low concurrency.
- Larger speculative blocks increased acceptance length, but did not consistently improve throughput. At C16, the block-16 result was slightly slower than block 8 in this single-run comparison.
- The block-16/C16 GPU capture showed more expensive causal-convolution and Gated DeltaNet decode invocations than block-8/C16, even though those two kernels had unchanged invocation counts.
The more ambitious claim—that recurrent-state processing causes block 16 to lose throughput at C16—is still a hypothesis. I would want repeated unprofiled benchmarks, better phase attribution, and normalized profiler measurements before making it.
Next: connect GPU kernels to DFlash phases
The next investigation is source-level. I want to follow one speculative cycle through draft generation → target verification → acceptance → state update, and place targeted timing ranges around the relevant execution functions.
That would let me ask more precise questions: Does a larger block increase draft cost disproportionately? Is verification more expensive? Which operations are on the critical path? How much GPU work is done per accepted token?
There may also be a case for adaptive block sizing. The throughput measurements favored block 16 at C4 and block 8 at C16. But runtime switching introduces real questions around CUDA graph capture, buffer shapes, state management, and scheduler compatibility. It is a potential direction, not an implemented optimization.
Takeaway
The experiment began with a straightforward assumption: proposing more tokens should make speculative decoding faster.
What I found was a more useful systems lesson: more accepted tokens do not necessarily mean more useful tokens per second. Speculative decoding changes the amount and shape of the work done by the GPU, and its payoff depends on concurrency as well as acceptance length.
Benchmarking told me where the tradeoff appeared. Nsight Systems exposed concrete kernel-level differences worth investigating. Understanding how those differences map to DFlash’s execution phases is the next step.
References
- DFlash project and Qwen3.5-9B DFlash checkpoint
- SGLang repository
- Qwen/Qwen3.5-9B
- NVIDIA Nsight Systems
Scope: a single GB200, synthetic prompts, SGLang 0.5.23, one unprofiled benchmark run per configuration, and short profiling captures. Results should not be generalized to other model families, GPUs, workload distributions, or production serving scenarios without additional experiments.